Create Sales Targets for your Organization!
D365 Sales is very robust at managing:
- Leads
- Opportunities
- Quotes
- Orders*
- Invoices*
*While most organizations don’t use a CRM for Orders and Invoices, D365 is fully equipped to store that data and the entities can be customized/configured organizational needs. Also, the out-of-box integration between D365 and Business Central (that is used for order/invoice management) allows for D365 Sales to hold synced order/invoice data that originates in Business Central.
All the sales data being in one system (D365) is advantageous because it allows organizations to build forecasting around relevant (and real) transactions.
In D365 Sales, the “Forecasts” feature allows:
- Sellers can track performance against targets and identify pipeline risks that might jeopardize their ability to hit them
- Managers can track individual sales performance against quotas to proactively provide coaching
- Directors can use forecast trends to anticipate departmental sales and reallocate resources if necessary
- Organization leaders can use the projected estimates to change the product strategy or provide updated projections to investors
To learn more about Forecasts: https://learn.microsoft.com/en-us/dynamics365/sales/configure-forecast
In this article, we’ll focus on how to create a basic sales forecast. There are a lot of variations you can add to a forecast, but creating a simple one will give you an understanding of how the feature works…and then you can add complexity to it!
Before clicking/configuring in D365, there are a couple of decisions to make:
1- What table will be used to measure the forecast?
- Leads, Opportunities, Quotes, Orders, Invoices
- Which of these tables holds the data that gives you true reflection of your organization’s revenue
2- Is the hierarchy based on:
- Organization structure
- Product line
- Territory/region
For our scenario, we’ll use opportunities and organizational structure. Understanding/deciding these points make it more straight-forward during configuration.
To create a sales forecast:
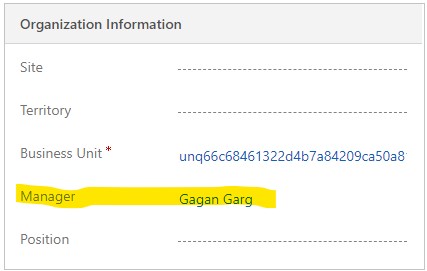
1. Since we’re creating a forecast based on organization structure, ensure all users (ie. salespeople) have the appropriate user in the “Manager” field (in the “User” record):
2. Navigate to App Settings à Forecast configuration
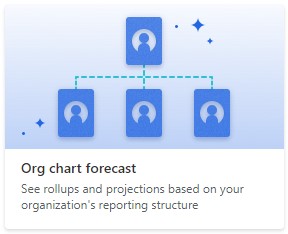
Click “Org Chart forecast”
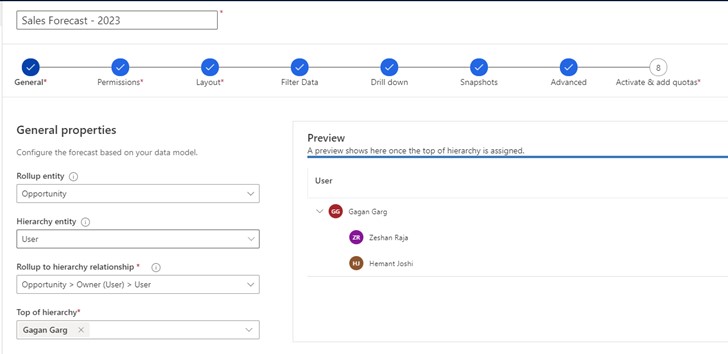
3. Fill out “General Section”
Rollup entity = Opportunity
Hierarchy entity = User
Top of hierarchy = [Select “Manager” from user records]
Once a user is selected (for top of hierarchy), all users that have the selected user as “Manager” will appear in the “Preview” section.
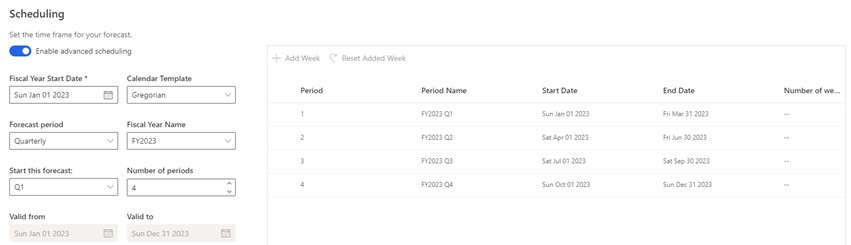
There are several variations to creating a schedule; the one illustrated is commonly-used (fiscal year, divided by quarters).
4. “Permissions” Section
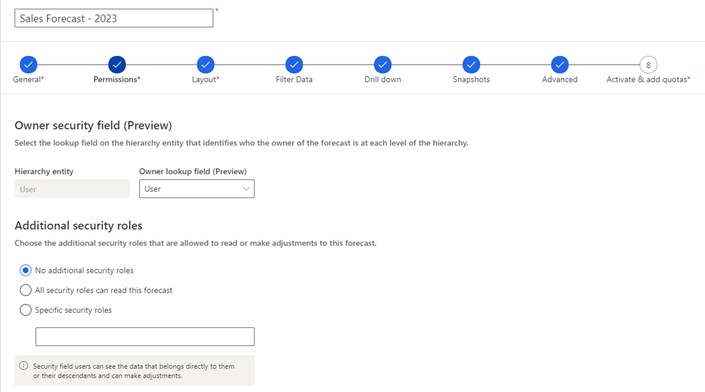
No changes need to be made (the default values are sufficient for this example).
5. “Layout” Section
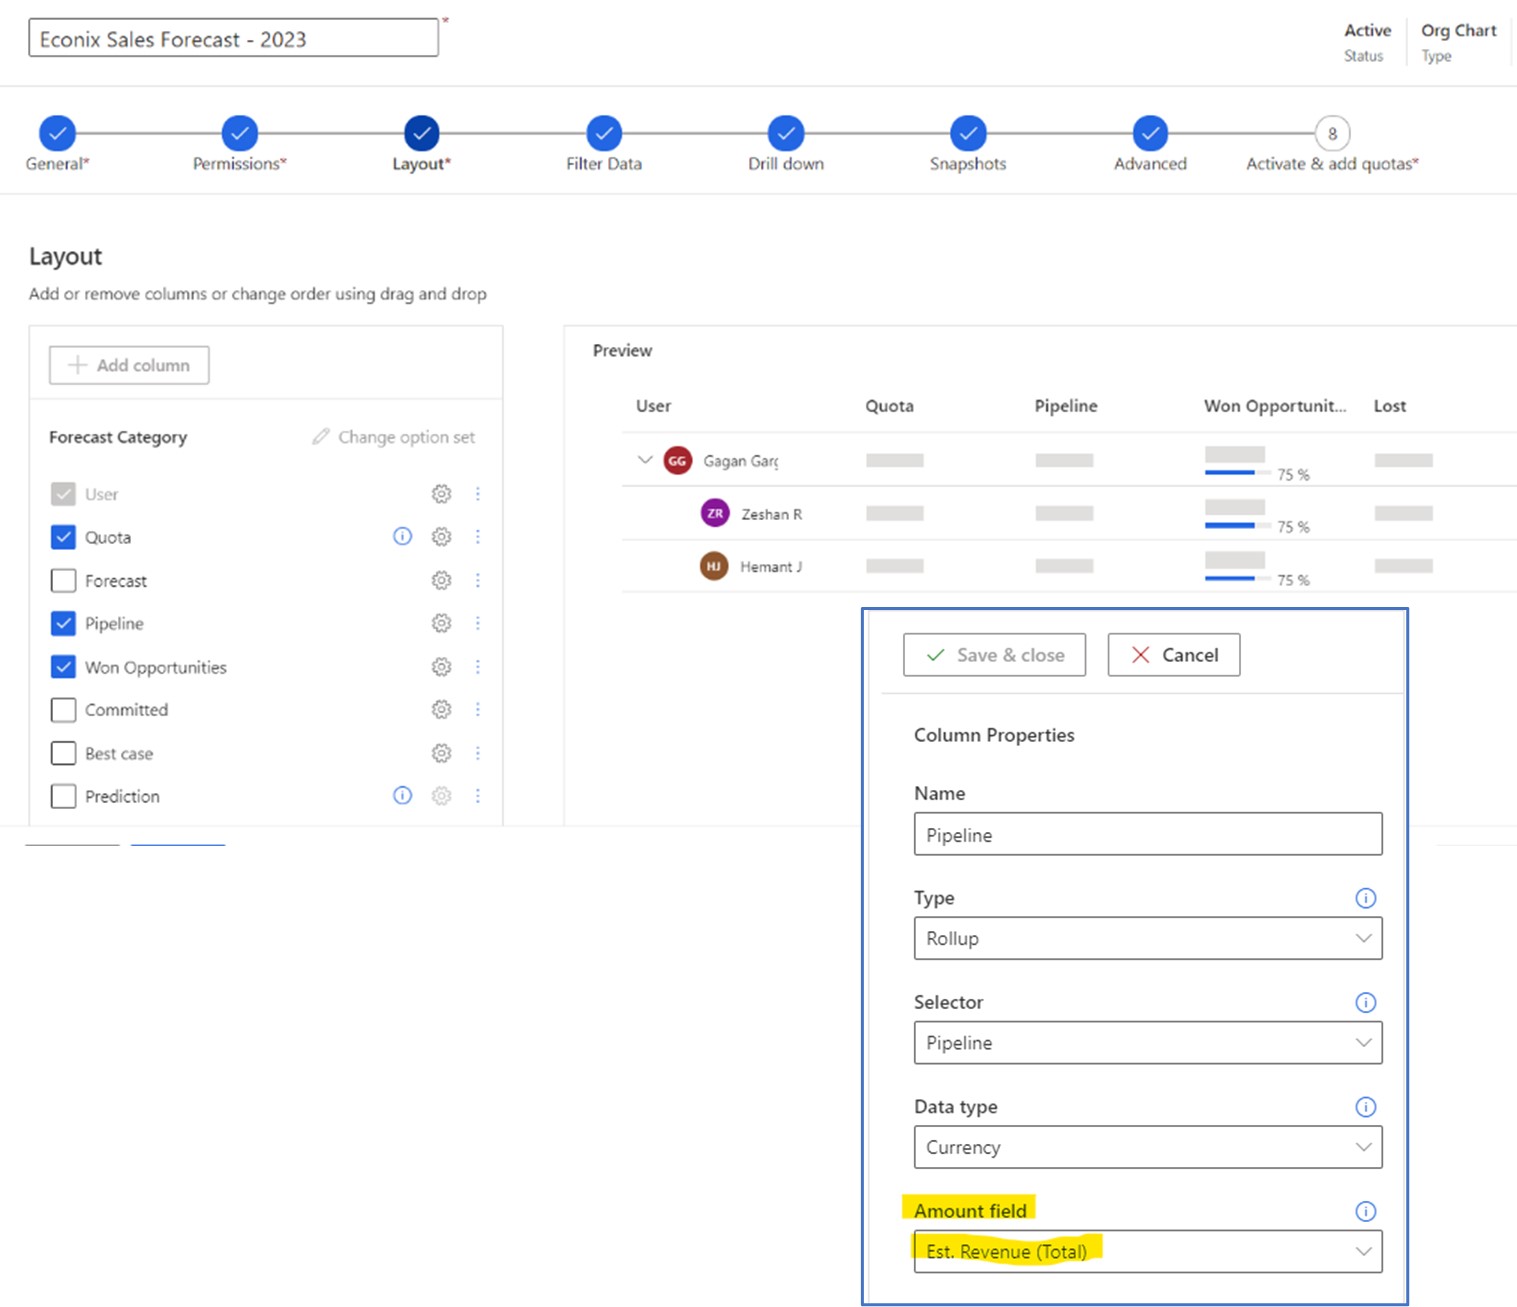
“Forecast Category” allows you to map different stages to actual fields from the opportunity entity.
For example, you can have the “Pipeline” stage of the forecast sum the value of “Est. Revenue (Total)”.
For other stages (Won Opportunities, Committed, etc), you can select other fields from the opportunity entity.
Not all stages have to be selected (eg. Committed and Best Case may seem redundant).
6. “Filter Data” Section
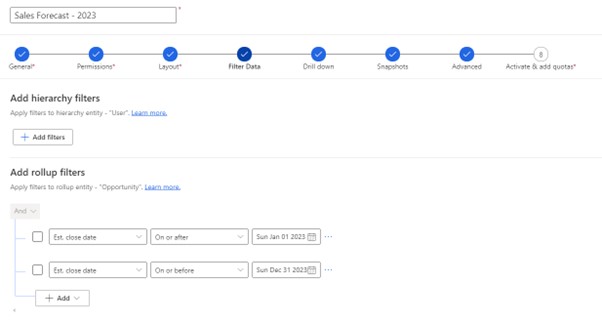
Adding a filter for on “Est. Close Date” ensures that opportunities with a date in 2023 will be calculated as part of the forecast.
7. “Drill Down”, “Snapshots”, and “Advanced” Sections
- We can ignore these advanced measures for now
- These can be explored at a later time
8. “Activate & Add Quotas” Section
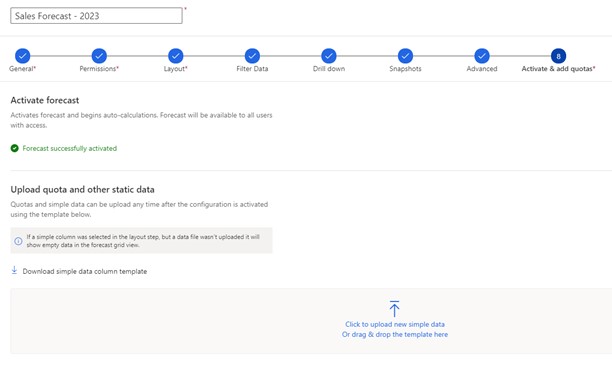
Clicking on “Activate” (it’s blue before clicked, becomes “Forecast successfully activated” after clicking) will make another link clickable:
Download simple data column template
An Excel sheet is downloaded onto your computer. This will be manually populated with forecast values and then uploaded back to D365.
In our example, we’re assigning each of the 2 salespeople a quarterly quota of $300. It means that total quota for each quarter is $600.
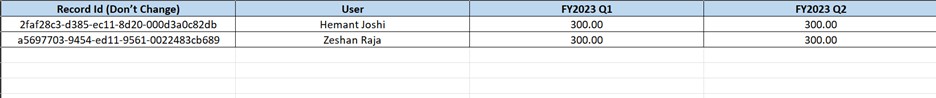
After saving the Excel file, upload it back into D365.
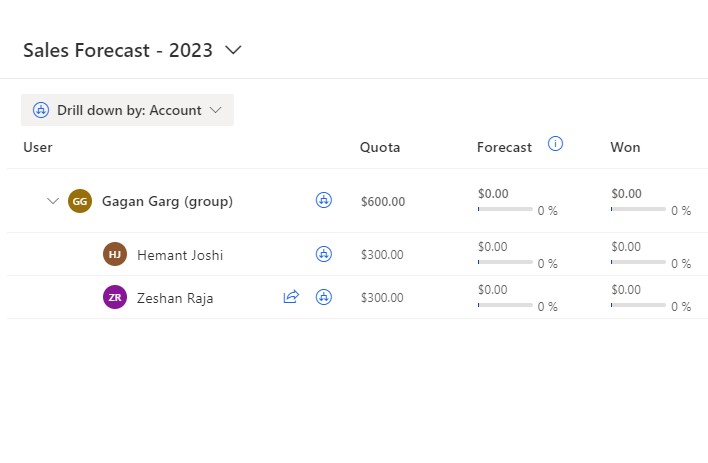
Once uploaded, you can navigate to Sales -> Forecasts to see the forecast chart. As you add and win opportunities, the “Forecast” and “Won” columns will populate with values.
If you are looking to maximize your D365 experience, feel free to reach out to us!
Also, look for new posts in coming weeks that show you other ways your organization can unlock the potential of D365 suite of applications!
Take care!
Zeshan Raja
Director of Sales
Econix InfoTech Ltd.
zraja@econix.ca
Connect With Us for Dynamics 365 Sales Services
LATEST INSIGHTS
-
Business Central customize pages for profiles
-
Adding Regional Formats to Reports in Dynamics 365 Business Central
-
Dynamics 365 Business Central – How to create Sell Products with a Customer Sales Order
-
Cash Flow in Dynamics Business Central Overview
-
Understand Location cards in D365 Business Central
REQUEST
FOR A CALL BACK
Provide discussion information and we’ll get back to you as soon as possible
Microsoft Services & Solution


Customer Satisfaction
Satisfaction
0%


Address
Corporate Office
Econix InfoTech Ltd.
10B-111 REGINA RD, WOODBRIDGE, ON L4L 8N5, Canada
Request a Business Consultation
Subscribe Newsletter
Copyright© 2018-2024 ECONIX InfoTech & Group Companies. All Rights Reserved